Monday, April 11, 2022

Sitecore Publishing Service - Using Sitecore PowerShell Extensions To Move Publishing Jobs To The Top Of The Queue

Standard

Background

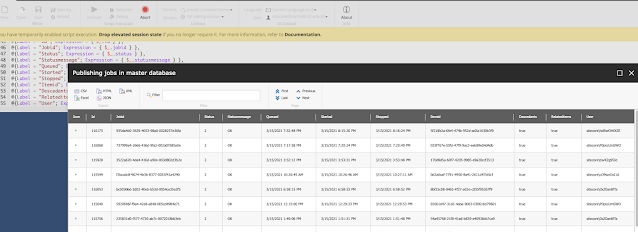
In my previous post, I provided a way to get a job queue report using PowerShell Extensions (SPE). In this post, I am going to show how you can use the output from the report to promote publishing jobs to the top of the queue using SPE.

Large Publishing Queue

You may ask, well why? Sitecore's Publishing Service is a great improvement over the out-of-the-box publishing mechanism, and is pretty fast at publishing items.

That is indeed true, however when working with extremely large sites with several hundred content authors and multiple publishing targets, the queue can become extremely long. I have seen it grow to upwards of several thousands items, and publishing taking several hours.

This is problematic if you have something urgent that needs to be published, as the job could be sitting in the queue for hours!

The Solution

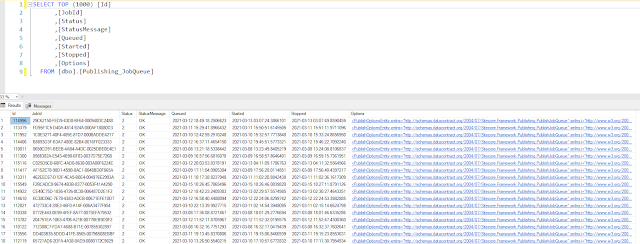
As you saw in my last post, it is pretty simple to access the SQL publishing queue database table using SPE. As the operations of a queue make it a first-in-first-out (FIFO) data structure based on the "Queued" datetime field,  I discovered that simply updating target job's datetime field to a smaller value, would instantly move the job higher in the queue.


So, my final logic was this:

  • Get smallest Queued datetime of the jobs sitting in the queue that still needed to be published
  • Subtract 2 minutes from the value
  • Update the queued datetime of job that I want to promote to the top of the queue with this new smaller datetime value
  • Done! My job was popped to the top!

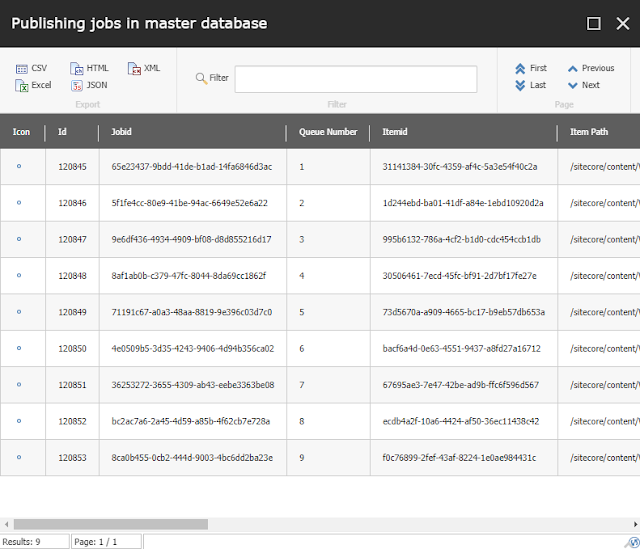
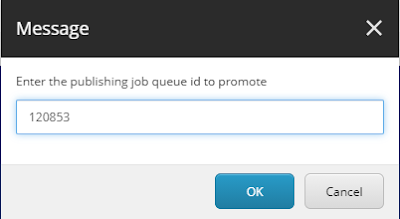
Now, this is the perfect pairing with the job queue report from my previous post. You can use the report to find the job and its id that you want to promote, and then use the id to run the script to promote the job!

I recommend following this guide to convert this into your own SPE custom module for your solution: Modules - Sitecore PowerShell Extensions


I hope you find this script another useful add to your PowerShell toolbox.

Sunday, March 20, 2022

Sitecore Publishing Service - Publishing Job Queue Report Using Sitecore PowerShell Extensions

Standard

Background

Sitecore's Publishing Service only allows you to see a maximum of 10 items at a time within the Queued or Recent jobs reports within the dashboard.

This is not ideal if you need to see how many total items are in the queue, need to get an estimate of how long it will take to get your publish live or quite simply need to do any type of analysis or troubleshooting.

Usually, you will have to talk to a DevOps person who has access to your Sitecore Master database, and get them to write a somewhat complex SQL query against your Publishing_JobQueue table to get you the information that you need.

It is a bit complex due to the fact that most of the key information is stored in an XML field called "Options" within this particular table.


PowerShell For The Win

After spending a bit of time formulating a decent SQL query that would get the key information that we were after, I decided to take it one step further by incorporating it into a PowerShell script that could be generated on demand from within the Sitecore console, and also output a searchable and downloadable report.

A clear win for our Authoring Admins and DevOps teams!

I hope you find this script a useful add to your PowerShell toolbox.


Sunday, March 13, 2022

Sitecore Content Hub - Set up SAML-based SSO in Azure AD using an App Registration

Standard

Background

In this post, I will show you how to create and configure an Azure Application Registration in your tenant to allow Sitecore Content Hub users to successfully authenticate against your Azure Active Directory.

Options

The Content Hub team's preferred set up option is to create an Enterprise application within your Azure AD, but unfortunately for us, our DevOps would not allow this due to very strict security constraints that we had to abide by. This is the main reason that we had to go the App Registration route.

We initially tried to get the App Registration working using Microsoft Provider SSO, but could not get the proper Group claims working correctly.

As a result, we focused on configuring SAML Auth within our App Registration, and were able to get all the claims needed to successfully get SSO authentication working with this approach.

Set up within Azure

Within your Azure Portal, find App registrations and click on the New Registration button. Give it a name, and leave the default options selected, and click Register.


Within the newly created registration, go to the Authentication menu option within the Manage section.

Click "Add a platform", and then select "Web".


Set your Redirect URIs to be the Content Hub portal url. You will be able to add additional URIs after the initial set up. For now, I will use a default one.

Make sure you check the Access tokens and ID tokens boxes within the Implicit grant and hybrid flows section.


After this, click the Configure button.

Next, go to the Token configuration menu option within the Manage section.

Click Add group claim, and check the Security group box. Confirm that the Group ID radio option is selected within the ID, Access and SAML options.

Click the Add button.


Next, click Add optional claim.

Within Token type, select SAML, and check the email Claim box. Click Add.


When prompted, check the "Turn on the Microsoft Graph email permission" box to allow the claims to appear in the token. Click Add.


Next, go to the Expose an API menu option within the Manage section. Click Add a scope, and it will generate an Application ID URI for you. 

Make note of this, as you will need it for the Content Hub side.

Click Save and continue.


After is has been created, you can click the Cancel button.


Go to the Overview menu option, and click Endpoints. Go to the Federation metadata document XML url and make note of it

Then, copy and past it into a new browser tab.


Make note of the entityID.

Your set of notes should look similar to this:


Set up within Content Hub

Log into your Content Hub portal. Click on Manage, and then go to Settings.


Within Settings, go to PortalConfiguration, and select the Authentication menu option. Change the view to Text as it's easier to work with.

Within the ExternalAuthenticationProviders, saml XML config, set the key values to what you saved in your notes. Make sure you set the provider_name and add some basic messages.


Example:
 ExternalAuthenticationProviders": {  
   "global_username_claim_type": "http://schemas.xmlsoap.org/ws/2005/05/identity/claims/name",  
   "global_email_claim_type": "http://schemas.xmlsoap.org/ws/2005/05/identity/claims/emailaddress",  
   "google": [],  
   "Microsoft": [],  
   "saml": [  
    {  
     "metadata_location": "https://login.microsoftonline.com/8ac76c91-e7f1-41ff-a89c-3553b2da2c17/federationmetadata/2007-06/federationmetadata.xml",  
     "sp_entity_id": "api://c8696890-1d5f-479b-9df1-154e8f315165",  
     "idp_entity_id": "https://sts.windows.net/8ac76c91-e7f1-41ff-a89c-3553b2da2c17/",  
     "password": null,  
     "certificate": null,  
     "binding": "HttpRedirect",  
     "authn_request_protocol_binding": null,  
     "is_enabled": true,  
     "provider_name": "martinSamlNewLocal",  
     "messages": {  
      "signIn": "Martin SAML SSO Test"  
     },  
     "authentication_mode": "Passive"  
    }  
   ],  
   "sitecore": [],  
   "ws_federation": [],  
   "yandex": []  
  }  

Click Save, and you are done!

You are now ready to test out your authentication using your shiny, new authentication button.

Users with more than 200 groups

We found a limitation with SSO authentication group claims in Azure AD https://docs.microsoft.com/en-us/azure/active-directory/hybrid/how-to-connect-fed-group-claims wherein if there are more than 200 groups associated to a user, then the SSO authentication will provide a graph link instead of passing in the group claims. 

There is currently no solution for this problem. We are handling these handful of users via manual security set up.

Monday, January 3, 2022

Fix Email Campaign Pausing: Sitecore Email Experience Manager 3.x Retry Data Provider

Standard

Background

My company uses Email Experience Manager (EXM) to send several million emails a day, and we have been facing issues where our large campaigns would pause mid-send.

We have a scaled EXM environment with 2 dedicated dispatch servers, and a separate SQL Server, all with appropriate resources so the hardware was not an issue. We also ensured that databases were kept in tiptop condition (proper maintenance plans with stats being updated), and configurations where optimal for our environment.


The causing of the pausing

After digging in, I discovered that the pausing was caused by SQL deadlocks due to the massive amount of records and CRUD activity on the EXM SQL databases.

Sample Exception:

 ERROR Transaction (Process ID 116) was deadlocked on lock | communication buffer resources with another process and has been chosen as the deadlock victim. Rerun the transaction.  
 Exception: System.Data.SqlClient.SqlException  
 Message: Transaction (Process ID 116) was deadlocked on lock | communication buffer resources with another process and has been chosen as the deadlock victim. Rerun the transaction.  
 Source: .Net SqlClient Data Provider  
   at System.Data.SqlClient.SqlConnection.OnError(SqlException exception, Boolean breakConnection, Action`1 wrapCloseInAction)  
   at System.Data.SqlClient.TdsParser.ThrowExceptionAndWarning(TdsParserStateObject stateObj, Boolean callerHasConnectionLock, Boolean asyncClose)  
   at System.Data.SqlClient.TdsParser.TryRun(RunBehavior runBehavior, SqlCommand cmdHandler, SqlDataReader dataStream, BulkCopySimpleResultSet bulkCopyHandler, TdsParserStateObject stateObj, Boolean& dataReady)  
   at System.Data.SqlClient.SqlDataReader.TryHasMoreRows(Boolean& moreRows)  
   at System.Data.SqlClient.SqlDataReader.TryReadInternal(Boolean setTimeout, Boolean& more)  
   at System.Data.SqlClient.SqlDataReader.Read()  
   at System.Data.SqlClient.SqlCommand.CompleteExecuteScalar(SqlDataReader ds, Boolean returnSqlValue)  
   at System.Data.SqlClient.SqlCommand.ExecuteScalar()  
   at Sitecore.Modules.EmailCampaign.Core.Data.SqlDbEcmDataProvider.CountRecipientsInDispatchQueue(Guid messageId, RecipientQueue[] queueStates)  
   at Sitecore.Modules.EmailCampaign.Core.Gateways.DefaultEcmDataGateway.CountRecipientsInDispatchQueue(Guid messageId, RecipientQueue[] queueStates)  
   at Sitecore.Modules.EmailCampaign.Core.Analytics.MessageStatistics.get_Unprocessed()  
   at Sitecore.Modules.EmailCampaign.Core.Analytics.MessageStatistics.get_Processed()  
   at Sitecore.Modules.EmailCampaign.Core.MessageStateInfo.InitializeSendingState()  
   at Sitecore.Modules.EmailCampaign.Core.MessageStateInfo.InitializeMessageStateInfo()  
   at Sitecore.Modules.EmailCampaign.Factory.GetMessageStateInfo(String messageItemId, String contextLanguage)  
   at Sitecore.EmailCampaign.Server.Services.MessageInfoService.Get(String messageId, String contextLanguage)  
   at Sitecore.EmailCampaign.Server.Controllers.MessageInfo.MessageInfoController.MessageInfo(MessageInfoContext data)  
   

How does this new data provider fix the problem?

The new data provider introduces efficient SQL deadlock handling. When a deadlock is detected, it will wait 5 seconds and then retry the transaction. The code will try to execute a deadlocked transaction 3 times.

Configuration

Defaults are set to wait 5 seconds for the retry, and the max retry attempts is 3. The DelaySeconds and RetryCount settings can be modified to suit your needs.

 <configuration xmlns:patch="http://www.sitecore.net/xmlconfig/">  
  <sitecore>  
   <ecmDataProvider defaultProvider="sqlretry">  
    <providers>  
     <clear/>  
     <add name="sqlretry" type="Sitecore.EmailCampaign.RetryDataProvider.RetrySqlDbEcmDataProvider, Sitecore.EmailCampaign.RetryDataProvider" connectionStringName="exm.master">  
      <Logger type="Sitecore.ExM.Framework.Diagnostics.Logger, Sitecore.ExM.Framework" factoryMethod="get_Instance"/>  
      <DelaySeconds>5</DelaySeconds>  
      <RetryCount>3</RetryCount>  
     </add>  
     <add name="sqlbase" type="Sitecore.Modules.EmailCampaign.Core.Data.SqlDbEcmDataProvider, Sitecore.EmailCampaign" connectionStringName="exm.master">  
      <Logger type="Sitecore.ExM.Framework.Diagnostics.Logger, Sitecore.ExM.Framework" factoryMethod="get_Instance"/>  
     </add>  
    </providers>  
   </ecmDataProvider>  
  </sitecore>  
 </configuration>  

Source Code and Documentation

Full source code, documentation and package download is available from my GitHub repository:

https://github.com/martinrayenglish/Sitecore-EXM-3.x-Retry-Data-Provider

Sunday, November 7, 2021

Sitecore Publishing Service - Publishing Sub Items of Related Items

Standard

Background

We ran into an issue with our Sitecore 9.1 and Publishing Service 4.0 environment where when a page item with a rendering was being published, the corresponding data source of the rendering was not published fully.

To be more specific, if the rendering referred to a data source item that had multiple levels of items, then only the root of the data source was being published but not the child items.

A good example would be a navigation rendering that had a data source item with a lot of children. Content authors were making updates to all the link items within Experience Editor, but they were not being published.

This was happening for both manual publishing and publishing through workflow.


Configuration Updates

In our research, we discovered that publishing service allows you to specify the templates of the items you wish to publish as descendants of related items. 

Adding the following node to sc.publishing.relateditems.xml did trick (after a restart):

It is very important to note that the the template nodes need to have unique names in order for this to work. 

In other words: DatasourceTemplate1, DatasourceTemplate2, DatasourceTemplate3 etc. 

So as you can imagine, if you want to include a lot of data source item templates, the list in your configuration can get extremely large!

Final Words

I hope that this information helps developers who face a similar issue, as I could not find anything online about this related publishing configuration.

As always, feel free to comment or reach me on Slack or Twitter if you have any questions.                                                    

Thursday, September 30, 2021

Understanding Sitecore's Self-Adjusting Thread Pool Size Monitor

Standard

Background

In a previous post, I focused on the inner workings of the .NET CLR and Thread Pool and how they can impact the stability of the Sitecore application.

I must admit, I have become mildly obsessed with the threading over the last couple years, mostly because a great deal of my work has involved stabilization and optimization practices on high-traffic Sitecore sites. 

In this post, I want to focus in the Thread Pool Size Monitor that comes baked into Sitecore from 9 onwards, because it is not widely known that it exists, the job it does, and how it can be tuned to optimize performance.

Thread Pool Size Monitor

To recap, the most important thread configuration settings are the minWorkerThreads and minIOThreads where you can specify the minimum number of threads that are available to your application's Thread Pool instead of relying on the default formula's based on processor count which is always too few.

Threads that are controlled by these values can be created at a much faster rate (because they are spawned from the Thread Pool), than worker threads that are created from the CLR's default "thread-tuning" capabilities. 

To summarize: 

  • Thread pool threads get thrown in faster to handle work. 
  • The CLR thread spin up algorithm is too slow and we can't rely on it to support high performance applications.

As previously mentioned, in Sitecore 9 and above, there is a pipeline processor that allows the application to adjust thread limits dynamically based on real-time thread availability (using the Thread Pool API).

This can be found in the following namespace: Sitecore.Analytics.ThreadPoolSizeMonitor.

By default, every 500 milliseconds, the processor will keep adding a value of 50 to the minWorkerThreads setting via the Thread Pool API until it determines that the minimum number of threads is adequate based on available threads.

How It Works

Since a picture is worth a thousand words, I put together a diagram of how the logic of the Thread Pool Size Monitor logic works, and provided an example with the default settings that are set on an Azure P3v2 App Service that has 4 cores.  


Custom Thread Pool Size Monitor Configuration

An enhancement that I have made on my past 9.1 PaaS implementation was to tune Sitecore’s dynamic thread processor using a more “aggressive” configuration. This helped me with those “bursty” web traffic situations where I needed to be sure that I had enough threads available to serve the current demands. 

Here is the configuration that I used:

Tuesday, September 21, 2021

Sitecore xDB - Troubleshooting xDB Index Rebuilds on Azure

Standard
In my previous post, I shared some important tips to help ensure that if you are faced with an xDB index rebuild, you can get it done successfully and as quickly as possible.

I mentioned a lot of things in the post, but now, I want to mention common reasons where and why things can go wrong, and highlight the most critical items that impact the rebuild speed and stability.


Causes of Need To Rebuild xDB Index

Your xDB relies on your shard database's SQL Server change tracking feature in order to ensure that it stays in sync. This basically determines how long changes are stored in SQL. As mentioned in Sitecore's docs, the Retention Period setting is set to 5 days for each collection shard. 

So, why would 5-day old data not be indexed in time?
  • The Search Indexer is shut down for too long
  • Live indexing is stuck for too long
  • Live indexing falls too far behind

Causes of Indexing Being Stuck or Falling Behind, and Rebuild Failures

High Resource Utilization: Collection Shards 
99% of the time, this is due to high resource utilization on your shard databases. Basically, if you see your shard databases hitting above 80% DTUs, you will run into this problem.

High Resource Utilization: Azure Search or Solr
If you have a lot of data, you need to scale your Azure Search Service or Solr instance.  Sharding is the answer, and I will touch in this further down.

What to check?

If you are on Azure, make sure your xConnect Search Indexer WebJob is running.
Most importantly, check your xConnect Search Indexer logs for SQL timeouts. 

On Azure, the Webjob logs are found in this location: D:\local\Temp\jobs\continuous\IndexWorker\{randomjobname}\App_data\Logs"

Key Ingredients For Rebuild Indexing Speed and Stability

SQL Collection Shards

Database Health 

Maintaining the database indexes and statistics is critically important. As I mentioned in my previous post:  "Optimize, optimize, optimize your shard databases!!!" 

If you are preparing for a rebuild, make sure that you run the AzureSQLMaintenance Stored Procedure on all of your shard databases.

Database Size

The amount of data and the number of collection shards is directly related to resource utilization and rebuild speed and stability. 

Unfortunately, there is no supported way to "reshard" your databases after the fact. We are hoping this will be a feature that is added to a future Sitecore release.

xDB Search Index

Similarly to the collection shards, the amount of data and the number of shards is directly related to resource utilization on both Azure Search and Solr. 

Specifically on Solr, you will see high JVM heap utilization.

If your rebuilds are slowing down or failing, or even if search performance on your xDB index is deteriorating, it's most likely due to the amount of data in your index, the number of shards and distribution amongst nodes that you have set up.  

Search index sharding strategies can be pretty complex, and I might touch on in these in a later post.

Reduce Your Indexer Batch Size

Another item that I mentioned in my previous post. If you drop this down from 1000 to 500 and you are still having trouble, reduce it even further. 

I have dropped the batch size to 250 on large databases to reduce the chance of timeouts (default is 30 seconds) when the indexer is reading contacts and interactions from the collection shards.