Monday, December 9, 2019

Huge xDB and xConnect Improvements in Sitecore 9.3

Standard
With the release of Sitecore 9.3, there is a lot of hype in the community around the new bells and whistles that the updated version of the platform offers.

What I am most excited about are the huge performance and stability improvements in xConnect and xDB, and in this post, I will highlight those key areas.


Search Indexer Rebuild Enhancements

Performance

Sitecore made some very important improvements to the stability of rebuilds in systems under stress scenarios, allowing for faster rebuilds:

  • Implemented batching and parallelization during the rebuild synchronization stage
  • Reduced the default SplitRecordsThreshold from 25,000 to 1,000
  • Reduced the ParallelizationDegree of the rebuild to half
  • The sync stage of rebuild can now finish if there is an indexing cycle where less than 25k of changes are detected.


New Commands

  • Check status of rebuild: -rebuildmonitor / -rm
    • Before you could just check logs for the completion entires
  • Delete obsolete data from index: -cleanuprebuildindex / -cri


Rebuild Resume

If you have a lot of interaction data, rebuilds can take a very long time!

If you have a hiccup during the process, there is finally an option to resume without having to start from scratch! A major feature to say the least.


Sharding Deployment Tool Enhancements

With the 9.3 Database Deployment Tool, we finally have the ability to add and remove shards to the xDB collection store. Adding is so important, as I mentioned in my previous post.

To summarize, additional collection shards means additional SQL compute capacity to serve incoming queries in the distributed configuration, and thus faster query response times and index builds. Additional shards will increase total cluster storage capacity, speed up processing, and offer higher availability at a much lower cost than vertical scaling.

You will be required to run an upgrade tool that will modify your pre 9.3 collection databases to allow for the ability to make these adds and removes to your shards.

Web Tracker Stability

The following improvements have been made to the Web Tracker's stability and performance:

  • Session expiration batching
  • Optimization of the Web Tracker and xConnect communication
  • Optimization of the Web Tracker and Reference Data Service communication


Reference Data Layer Redesign 

There have been a lot of issues in previous versions of 9.x that required patches and SQL database scripts to resolve. See my post on Critical Patches for 9.1.

In 9.3, this Reference Data layer has been completely redesigned from the ground up, with focus the main focus being on performance.

New TVP Provider

Sitecore uses table-valued parameters (TVP) to send aggregated information to SQL, because this is a very fast way to communicate with SQL server. Basically, you can use table-valued parameters to send multiple rows of data to a function or stored procedure without the overhead of creating a temporary table or using tons of parameters.

Sitecore has added a new TVP provider in 9.3, that provides major performance improvements.

Ability to Turn On and Off Performance Counters in Azure

If you are deploying to PaaS, performance counters are now disabled by default just like CMS counters.

With 9.3, you have the ability to switch performance counters off and on for xConnect, xDB and Cortex services.


Tuesday, October 15, 2019

Sitecore xDB Resharding Tool - Unlock xDB Storage and Performance Limitations by Increasing Collection Shards Without Data Loss

Standard

Background

There is currently no way for you to increase the number of xDB collection database shards for an existing deployment, without starting from scratch and losing all your data.

The release of my colleague Vitaly Taleyko's Sitecore xDB Resharding Tool solves this problem for all of us, as it provides us with a migration path from an old shard collection to a new one.

https://github.com/pblrok/Sitecore.XDB.ReshardingTool


The inability to increase shards after deployment is a major problem for enterprise customers using the platform, who may not be aware of how quickly the collection databases will grow over time.

If you are a Sitecore veteran, you have experienced this rapid collection growth in MongoDB. As soon as the platform is "turned on", it starts collecting interactions and events for both anonymous and identified contacts.

Putting a Sitecore environment into Production, means opening up the flood gates for a massive amount of data that you don't have much control over.

xDB Search Index

On the xDB index side of the house, Sitecore has filtered the interactions and contact data in the xDB index to identified contacts only (by default). This is good for simple customers who aren't doing much with the platform.

However, if you have millions of contacts, you will have the same index problems as you may have faced when dealing with anonymous contact data in previous versions mentioned in this blog post from a while ago. There is a solve for this, that I may touch on in a later post.

The 2 Shard SQL Problem

Out of the box, if you install the Sitecore platform using default scripts and SIF or if Sitecore Managed Cloud has set up your environment in Azure, you will have 2 SQL shard collection databases.

The value proposition of Sitecore xDB is the ability to store any events tied to an interaction from any channel in xDB. They have provided a robust set of APIs to allow this.

The problem is that storing hundreds of gigabytes or even terabytes of data requires a very carefully planned strategy, or else, you will fail. It is just a matter of when.

I always have the following scene from Evan Almighty in my head when I talk about this problem:


The bottom line - if you have an enterprise deployment, and are using xDB, the out of the box 2 shard collection database configuration is not enough!

New Deployments

If you are new to the Sitecore platform, you can fix this by using the Shard Map Manager Tool to increase the number of shards. This great post by Kelly Rusk explains how: http://thebitsthatbyte.com/what-is-and-how-to-use-the-sitecore-9-shard-map-manager-tool

Existing / Live Deployments

Bad news if you have an existing deployment.

You will hit bottlenecks as you store more contact, interaction and event data. With limited CPU, storage capacity and memory, database performance will start to suffer and query performance and routine maintenance will slow down.

When it comes to adding resources to support database operations, vertical scaling (aka scaling up which is very easy to do on Azure) has its own set of limits and eventually reaches a point of diminishing returns.

The Negative Ripple Effect on xDB

I have seen cases where due to the massive amount of data stored in the xDB collection shards over time, xConnect Search will fail to keep the xDB index in sync, and xConnect search will stop working.

After this happens, the only option is to rebuild your xDB index, but because of the poor xDB collection database performance, it will take days, if not weeks if you are lucky.

Or, it will simply keep failing.

How Increasing Shards Helps

Adding additional collection shards to xDB means additional SQL compute capacity to serve incoming queries in the distributed configuration, and thus faster query response times and index builds.

Additional shards will increase total cluster storage capacity, speed up processing, and offer higher availability at a much lower cost than vertical scaling.

How the xDB Resharding Tool Helps

As I started working with Vitaly to architect this tool, our first idea was to use the Data Exchange Framework that is used to power the xDB Migration Tool. We had used a customized version of this tool when we migrated from our Sitecore 8.2 deployment to our current 9.1.

We decided to pivot, because we wanted a lightweight tool that could run on any Windows-based machine, and would run directly against SQL and as a result, be much more efficient!

The Beauty of the Tool Part 1: Migrating Your Data

This tool allows you to reshard your Sitecore xDB Collection Databases without any data loss.

What does this mean exactly?!

This tool allows you to migrate your current SQL xDB analytics collection database shards to a new set of xDB analytics collection database shards without losing any of your data.

So, for example if you have 2 shard databases, and want to move up to 4 shard databases, this tool will allow you to migrate over.

For this example, you would set up 4 new shards using SIF (as shown in Vitaly's GitHub readme doc), or use the Shard Map Manager Tool, and then point the tool at your old shards and the new shards and voila! Your data will get migrated over!

The Beauty of the Tool Part 2: Resume Mode

Another fantastic feature that Vitaly added to this tool is "resume mode". If there is a glitch in the migration process, or you need to stop it manually for some reason and resume later, it will remember where it left off and pick the migration right back up!

Battle-Tested and Ready For Download!

This tool has been tested, and I can say that it works, and works well!

You can check the full source code out on Vitaly's GitHub: https://github.com/pblrok/Sitecore.XDB.ReshardingTool

You can download your copy today using this link: https://github.com/pblrok/Sitecore.XDB.ReshardingTool/raw/master/ToolReleases/win-x64.zip


Saturday, August 31, 2019

Sitecore xDB - Optimizing Your xDB Index Rebuild For Speed

Standard
Having performed Sitecore xDB index rebuilds many times with large data sets, I wanted to share some key tips to ensure a successful and speedy rebuild.

My experience has been on Azure PaaS, with both Azure Search and SolrCloud, but these techniques can be applied to on-premise and IaaS as well.

Change The Log Level

Before starting a large rebuild job, it's important to enable the proper logging in case you need to investigate any issues that may arise. By default, the log level is set to Warning. Change it to Information.

Navigate to the: App_Data\jobs\continuous\IndexWorker\App_data\config\sitecore\CoreServices\sc.Serilog.xml file, and change the MinimumLevel to Information: 
   <MinimumLevel>
      <Default>Information</Default>
    </MinimumLevel>

Optimize Your Indexer Batch Size

Don't be over eager with your indexer's batch size setting. This setting determines how many contacts or interactions are loaded per parallel stream during an index rebuild. This setting is found in the following location:
App_Data\jobs\continuous\IndexWorker\App_data\config\sitecore\SearchIndexer\sc.Xdb.Collection.IndexerSettings.xml file:
<BatchSize>1000</BatchSize>

I have had success reducing this size to 500, as it helps execution go faster and prevents you from hitting timeouts during your rebuild when your shard databases are under heavy load.

Reduce Your SplitRecordsThreshold

A good tip from a member of our Sitecore community. By default, this value is set to 25000. Tweaking and reducing this value can also make your rebuilds run faster, and improve your live indexing.

Like the Indexer Batch size, this setting is found in the following location:
App_Data\jobs\continuous\IndexWorker\App_data\config\sitecore\SearchIndexer\sc.Xdb.Collection.IndexerSettings.xml
<SplitRecordsThreshold>25000</SplitRecordsThreshold>

I have had success reducing this size to a little less than half the original value, 12000.

Reduce Your Index Writer's ParallelizationDegree

To decrease load in your Search Service, another good suggestion is to decrease the PrallelizationDegree Setting which is 4 by default.

You will see this in many of the other configs in your xConnect App Services. This setting determines how many parallel streams of data can be processed at the same time.

This setting is found in this location for Solr:
\App_Data\jobs\continuous\IndexWorker\App_data\config\sitecore\SearchIndexer\ sc.Xdb.Collection.IndexWriter.SOLR.xml
 <ParallelizationDegree>4</ParallelizationDegree>​

This setting is found in this location for Azure Search:
\App_Data\jobs\continuous\IndexWorker\App_data\config\sitecore\SearchIndexer\ sc.Xdb.Collection.IndexWriter.AzureSearch.xml
 <ParallelizationDegree>4</ParallelizationDegree>​

I have seen large improvements reducing this value from 4 to 1.

Optimize Your Databases

Optimize, optimize, optimize your shard databases!!!

If you are not already using the AzureSQLMaintenance Stored Procedure on your Sitecore databases, do it today!

This is critically important for not only your shard databases but also your other Sitecore databases like Core, Master and Web.  Marketing Automation and Reference databases also get hammered pretty hard, so make sure that this gets applied and run regularly on these.

Note that this maintenance is 100% necessary. As Grant Killian says: "The expectation that Azure SQL is a 'fully managed solution' is somewhat misleading, as rebuilding query stats and defragmentation are the user’s responsibility."

Sitecore recommends an approach like this: https://techcommunity.microsoft.com/t5/Azure-Database-Support-Blog/Automating-Azure-SQL-DB-index-and-statistics-maintenance-using/ba-p/368974

Schedule an Azure Automation “Runbook” to attend to this after hours for all Sitecore databases.

Run the Rebuild

After all this things have been completed, run the xDB rebuild as Sitecore's docs mentions.  In Kudu, go to site\wwwroot\App_data\jobs\continuous\IndexWorker and execute this command:

.\XConnectSearchIndexer.exe -rr

After this, you will see the magic start with docs in your inactive / rebuild index first be reset to 0, and then counts start gradually increasing.

Unfortunately, there is no way to see how far along you are. There is however a query that you can run against your Azure Search or Solr indexes to check the status.

Azure Search Query
$filter=id eq 'xdb-rebuild-status'&$select=id,rebuildstate

Solr Query
id:"xdb-rebuild-status"

Returned Index Rebuild Status:
Default = 0
RebuildRequested = 1
Starting = 2
RebuildingExistingData = 3
RebuildingIncomingChanges = 4
Finishing = 5
Finished = 6

Rebuild Success

When you run the status query, and you see a "6" (sometimes you will see "5" returned, and that's ok too),  you have a successfully completed the rebuild, and new data will start flowing into your xDB index.

Friday, August 9, 2019

Demystifying Pools and Threads to Optimize and Troubleshoot Your Sitecore Application

Standard

Background

If you are .NET application developer that works on Sitecore or not, it is important to have an understanding of how the Microsoft .NET Common Language Runtime (CLR) Thread Pool works will help you determine how to configure your application for optimal performance and help you troubleshoot issues that may present themselves in high traffic production environments.

This topic has been of great interest to me, and it's understanding has helped me troubleshoot and solve many difficult problems within the Sitecore realm.

I am hoping that this post helps other fellow Sitecore developers who may not be as familiar with the inner workings of the .NET CLR and Thread Pool, to have a starting pointing to understand where potential threading issues may occur if the application you support shows symptoms similar to what I intend to discuss.


Thread Pool and Threads 

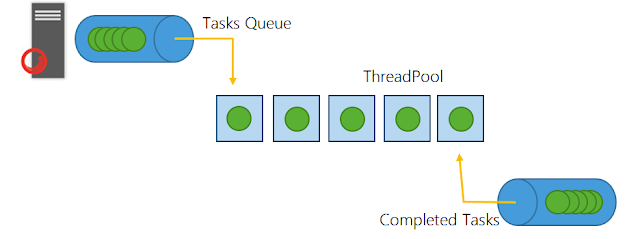
To put it simply, a thread pool is a group of warmed up threads that are ready to be assigned work to process. 

The CLR Thread Pool contains 2 types of threads that have different roles.

1) Worker Threads 

Worker threads are threads that process HTTP requests that come into your web server - basically they handle and process your application's logic. 

2) Input/Output (I/O) Completion Port or IOCP Threads 

These threads handle communication from your application's code to a network type resource, like a database or web service.

There is really no technical difference between worker threads and IOCP threads. The CLR Thread Pool keeps separate pools of each simply to avoid a situation where high demand on worker threads exhausts all the threads available to dispatch native I/O callbacks, potentially leading to a deadlock. However, this can still occur under certain circumstances.

Out of the Box / Default Thread Pool Thread Counts 

Minimums 

By default, the number of Worker and IOCP threads that your Thread Pool will have ready for work is determined by the number of processors your server has.

Min Formula: Processor Count =  Thread Pool Worker Threads = Thread Pool IOCP Threads

Example: If you have a server with 8 CPUs, you will start with only 8 worker and 8 IOCP threads.

Maximums 

By default, the maximum number of Worker and IOCP threads is 20 per processor.

Max Formula: Processor Count * 20 =  Max Thread Pool Worker Threads = Max Thread Pool IOCP Threads

Example:  If you have a server with 8 CPUs, the default max worker and IOCP threads will be 20 x 8 = 160.

Safety Switch 

The Thread Pool WILL NOT inject new threads when the CPU usage is above 80%. This is a safely mechanism to prevent overloading the CPU.

The Thread Pool In Action

As requests come into your web server, the Thread Pool will inject new worker or I/O completion threads when all the other threads are busy until it reaches the "Minimum" number for each type of thread.

After this "Minimum" has been reached, the Thread Pool will throttle the rate at which it injects new threads and will only add or remove 1 thread per 500ms / 2 threads per second, or as a thread has completed work and becomes free, whatever comes first.

Through its "hill climbing technique algorithm", it is self-tuning and will stop adding threads and remove them if they are not actually helping improve throughput. The thread injection will continue while there is still work to be done until the "Maximum" number for each thread type has been reached.

As the number of requests is reduced, the threads in the Thread Pool start timing out waiting for new work (if an existing thread stays idle for 15 seconds), and will eventually retire themselves until the pool shrinks back to the minimum.

"Bursty" Web Traffic, Thread Starvation and 503 Service Unavailable

Let's say you have your Sitecore site running on an untuned, single Content Delivery server that has 8 processors with the default Thread Pool thread settings. For the sake of the simple example, let's assume we have an under-powered web service (perhaps used for looking up customer information from a backend CRM system) that under heavy load takes 5 seconds to provide a response to a request. Our developers have not implemented asynchronous programming in this example, and use the HttpWebRequest class.

We start out with 8 warmed up and ready worker and IOCP threads in our Thread Pool.

Now, lets say we have burst of 100 visitors accessing different pages (pages that consume the web service) on our site at the same time. The Thread Pool will quickly assign the 8 threads to handle the first 8 requests that will be busy for the next 5 seconds, while the other 92 sit in a queue. As you can see, it will take many 500ms intervals to catch up with the workload. IIS will wait some time for the threads to get free, so that the requests in queue can be processed. If any thread gets free in the waiting time, then it will be used to process the request. Otherwise IIS will return a 503 Service Unavailable error message. Both the slow web service and the untuned Thread Pool will result in some unhappy visitors seeing the 503 error message.

Looking at this a bit closer, a call to a web service uses one worker thread to execute the code that sends the request and one IOCP thread to receive the callback from the web service. In our case, the Thread Pool is completely saturated with work, and so the callback can never get executed because the items that were queued in the thread pool were blocked.

This problem is called Thread Pool Starvation - we have a "hungry" queue waiting to be served threads from the pool to perform some work, but none are available.

This example is a good reason for using asynchronous programming. With async programming, threads aren’t blocked while requests are being handled, so the threads would be freed up almost immediately.

Optimizing Thread Settings 

The ability to tune / manage thread settings has been available in the .NET framework for ages - since v1.1 actually.

Arguably, the most important settings are the minWorkerThreads and minIOThreads where you can specific the minimum number of threads that are available to your application's Thread Pool out of the gate (overriding the default formula's based on processor count as described above).

Threads that are controlled by these settings can be created at a much faster rate (because they are spawned from the Thread Pool), than worker threads that are created from the CLR's default "thread-tuning" capabilities - 1 thread per 500ms / 2 threads per second when all available threads in the pool are busy.

These and other important thread settings can be set in either your server's machine configuration file (in the \WINDOWS\Microsoft.Net\Framework\vXXXX\CONFIG directory) or with the Thread Pool API.

Beware: Out-of-Process Session State and Redis Client  

Out-of-Process Session State

If you are using Out-of-Process Session State in your Sitecore environment, you need to tune your Thread Pool!

Each of your Sitecore Content Delivery instances are individually configured to query expired sessions from your session store. This mechanism will add a ton of additional request overhead to your CD instances, and if your Thread Pools aren't tuned to handle this, you will find yourself in a Thread Starvation situation.

For more background on how and why this happens, please check out Ivan Sharamok's great post: http://blog.sharamok.com/2018-04-07/prepare-cd-for-experience-data-collection

Redis Client

If you are running your Sitecore environments on Microsoft Azure, you will be using Redis for session management. Sitecore makes use of the StackExchange.Redis client within the platform. Even though the client is built for high performance, it get's finicky if your Thread Pool threads are all busy, the "minimum" has been reached and thread injection slows down. You will start seeing Redis service request timeouts.

It is important for you to go through a Thread Pool tuning exercise to ensure that you don't run into Thread Starvation issues.

The nice thing is that the client prints Thread Pool statistics to your logs with details about worker and IOCP threads, to help you with your tuning exercise.

For more details, follow this Microsoft Redis FAQ link: https://docs.microsoft.com/en-us/azure/azure-cache-for-redis/cache-faq#important-details-about-threadpool-growth

Self-adjusting Thread Settings 

Lucky for us on Sitecore 9 and above, there is a pipeline processor that allows the application to adjust thread limits dynamically based on real-time thread availability (using the Thread Pool API).

By default, every 500 milliseconds, the processor will keep adding 50 to the minWorkerThreads setting via the Thread Pool API until it determines that the minimum number of threads is adequate based on available threads.

In my next post, I intend to explore this processor in detail and provide information on it's self-tuning abilities.

Thursday, May 16, 2019

Going to Production with Sitecore 9.1 on Azure PaaS: Critical Patches Required For Stability

Standard
After spending several months upgrading our custom solution to Sitecore 9.1, and launching on Azure PaaS, I have learned a lot about what it takes to eventually see the sunshine between those stormy clouds.

This is the first of a series of posts intended to help you and your team make the transition as smooth as possible.


Critical Patches

There are several patches and things that you will need to deploy that are imperative to your success on Azure PaaS.


High CPU - Excessive Thread Consumption

Sitecore traditional server roles (Content Management, Content Delivery etc) operate in a synchronous context while xConnect operations are asynchronous. Therefore, communication between your Sitecore traditional servers and xConnect are performed in a synchronous to asynchronous context.

This sync to async operation requires double the number of threads on the sync side in order to do the job.  This could result in there not being enough threads available to unblock the main thread.

Sitecore handled this excessive threading problem in their application code by building a custom thread scheduler. What this does is take advantage of a blocked thread to execute the operation, thus reducing the need for the additional thread, and making this synchronous to asynchronous context more efficient.

Great stuff right? Well, the problem that everyone will be faced with is that if you are not using an exact version of the System.Net.Http library, this thread scheduler simply doesn't work!

New versions of System.Net.Http don't respect the custom thread schedulers that Sitecore has built.

With the configurations that are shipped with Sitecore 9.x, the application uses the Global Assembly Cache to reference System.Net.Http, and 9 times out of 10, it will be a newer version of this library.

Without this thread scheduler working, you will end up with high CPU due to thread blocking, and your application will start failing to respond to incoming http requests.

In my case, I saw blocking appear in session end pipelines, and also in some calls on my Content Management server when working with EXM and contacts.

More detail about his issue, and the fix is described in this article: https://kb.sitecore.net/articles/327701

When you read the article, you would think that it doesn't apply to you because it is referring to .NET 4.7.2, and if you are working with Sitecore 9.x, the application ships using 4.7.1.

The truth is that it does! You need to perform the following actions in order to fix the threading problem:

1. Apply the binding redirect to your web.config to force Sitecore to use System.Net.Http version 4.2.0.0 mentioned in the article:


2. Deploy the System.Net.Http version 4.2.0.0 to the bin folder on all your traditional Sitecore instances.

NOTE: Make sure you remove any duplicate System.Net.Http binding redirect entries in your web.config, and that you only have the one described above.

Reference Data

First Issue

This first patch you need adds the ability to configure cache sizes and expiration time for the UserAgentDictionaryCache, ReferringSitesDictionary, and GeoIpDataDictionary, and the size for ReferenceDataClientDictionary cache. Without this patch, you will see high DTU (up to 100%) in your Reference Data database as there is a bug that allows the cache size to grow enormously, which leads to performance issues and shutdowns.

In order to fix the issue, you need to review the following KB article: https://kb.sitecore.net/articles/067230

In our 9.1 instance, I used the 9.0.1.2 version of the patch.

Second Issue

This first patch is not enough to fix your Reference Data woes. There is another set of Stored Procedure performance issues related to SQL when querying the Reference Data database. 

You will need to download and execute the following SQL scripts in order to fix this issue:
GetDefinitions.sql and SaveDefinitions.sql

Update 08/17/19
Sitecore provided an improved SQL script as the original scripts could lead to issues with the related operations in some scenarios (e.g. batch operations with GetDefinions returning only the first result).

Download the updated script here.

Redis Session Provider

First Issue

If you are on Azure PaaS, you will most definitely using Redis as your Out of Proc Session State Provider.

Patch 210408 is critical for the stability of session state in your environment https://kb.sitecore.net/articles/464570

This patch limits the number of worker threads per CPU core and also reserves threads so they can handle session end requests/threads with the least amount of delay as possible. Reading between the lines, this patch simply handles the Redis timeout issue more gracefully.

Without this, you will see session end events using all the threads and leaving no room to handle incoming http requests. After hanging for some time, they eventually end up with 502 error due to a timeout.

After applying the patch, the timeout settings referenced in this KB article will need to be made in both your web.config and Sitecore.Analytics.Tracking.config. You also want to update your pollingInterval to 60 seconds to reduce the stress on your Redis instance as well.

Note: Depending on how much traffic your site takes on, you may need to adjust the patch settings in order to free up more threads.

So for example, you can take the original settings, and add a multiplication factor of 3 or 4. As I mentioned before, this will be up to you to determine, based on your experienced load.

Example with multiplication factor of 3:


For my shared session tracker update, I created a patch file like the following:


Second Issue

Gabe Streza has a great post regarding the symptoms experienced when Redis instances powering your session state are under load: https://www.sitecoregabe.com/2019/02/redis-dead-redemption-redis-cache.html

It's important to read through his post, and also Sitecore's KB article: https://kb.sitecore.net/articles/858026

What both are basically saying is that you will need to create a new Redis instance in Azure, so that you can split your private sessions and shared sessions. So, to be clear, you will have one Redis Instance to handle private sessions and another to handle shared sessions.

I decided to keep my existing Redis instance to handle shared sessions, and used the new Redis instance to handle private sessions.

Similar to Gabe's steps, I created a new redis.sessions.private entry in the ConnectionString.config.

I then updated my Session State provider in my web.config to the following:

Final Thoughts 

These fixes have made a night and day difference on the stability of our high traffic 9.1 sites on Azure PaaS.

Feel free to reach out to me on Twitter or Sitecore Slack if you have any questions.

Monday, January 21, 2019

Improving the Sitecore Broken Links Removal Tool

Standard

Background

While working through an upgrade to Sitecore 9.1, I ran into a broken links issues that couldn't be resolved using Sitecore's standard Broken Links Removal tool.

While searching the internet, I was able to determine that I wasn't the only one that faced these types of issues.

In this post, I intend to walk you through the link problems that I ran into, and why I decided to create an updated Broken Links Removal tool to overcome the issues that the standard links removal tool wasn't able to resolve.

NOTE: The issues that I present in this post are not specific to version 9.1.  They exist in Sitecore versions going back to 8.x.


Exceptions after Upgrade Package Installation

After installing the 9.1 upgrade package and completing the post installation steps of rebuilding the links database and publishing, I discovered that lots of my site's pages started throwing the following exceptions:


The model item passed into the dictionary is of type 'Castle.Proxies.IGlassBaseProxy', but this dictionary requires a model item of type 'My Custom Model'.

During the solution upgrade, I had upgraded to Glass Mapper to version 5, so I thought that the issue could be related to this.  After digging in, I noticed that my items / pages that were throwing exceptions had broken links.  I determine this by turning on Broken Links using the Sitecore Gutter in the Content Editor.


Next, I attempted to run Broken Links Removal tool located at http://{your-sitecore-url}/sitecore/admin/RemoveBrokenLinks.aspx.

After it had run for several minutes, it threw the following exception:

ERROR Error looking up template field. Field id: {00000000-0000-0000-0000-000000000000}. Template id: {128ADD89-E6BC-4C54-82B4-A0915A56B0BD}
Exception: System.ArgumentException
Message: Null ids are not allowed.
Parameter name: fieldID
Source: Sitecore.Kernel
   at Sitecore.Diagnostics.Assert.ArgumentNotNullOrEmpty(ID argument, String argumentName)
   at Sitecore.Data.Templates.Template.DoGetField(ID fieldID, String fieldName, Stack`1 stack)
   at Sitecore.Data.Templates.Template.GetField(ID fieldID)

Digging In

I needed to understand why this exception was being thrown, and started down the path of decompiling Sitecore's assemblies.  My starting point for reviewing the code was Sitecore.sitecore.admin.RemoveBrokenLinks.cs which is the code behind for the Broken Links Removal page.

I took all the code and pasted it into my own ASPX page so that I could throw in a break point and debug what was going on.  After a lot of trial and error and a ton of logging,  I discovered that code that was throwing the error existed in the FixBrokenLinksInDatabase method on line 11 shown below:

If the Source Field ID / "itemLink.SourceFieldID" on line 11 is null (this is the field where it has determined that there is a broken link), the exception noted above will be thrown.

The Cause of the Null Source Field

During my investigation, I determined that the cause of this field being null was due to the item being created from a branch template that no longer existed.

To put this another way, the target item represented as the sourceItem in the code above (line 8), had a reference to a branch template that no longer existed, and the lookup for item was returning a null source field.

Through my code logging and Content Editor validation, I found that we had a massive amount of broken links caused by a developer deleting several EXM branch templates:


Stack Exchange and Sitecore Community uncovered some decent information regarding this type of issue, and how to solve it manually by running a SQL query:

https://community.sitecore.net/developers/f/8/t/1784

https://sitecore.stackexchange.com/questions/88/how-do-i-fix-a-broken-created-from-reference-when-the-branch-no-longer-exists/89

Now, to fix this problem automatically using the tool, I just needed to add a null check in the code, and also create a way to clean up the references to the invalid branch templates.

Improved Broken Links Tool

The outcome of my work was an improved Broken Links Removal tool that I call the "Broken Links Eraser".

The tool does everything that the Sitecore Broken Links Removal tool does, with the following improvements:

  • Detects and removes item references to branch templates that no longer exist.
  • Removes all invalid item field references to other items (inspects all fields that contain an id).
  • Allows you to target broken links using a target path, you don't have to run through every item in the target database. This is useful when working with large sets of content.
  • Has detailed logging while it is running and feedback after it has completed. 

The tool is built as a standalone ASPX page, so you can simply drop the file in your {webroot}/sitecore/admin folder to use it. No need to deploy assemblies and recycle app pools etc.


All updates were made using Sitecore's SqlDataApi, so the code is consistent with Sitecore's standards. The code is available on GitHub for you to download and modify as needed:


Final Thoughts

I hope that you find this tool useful in solving your broken link issues. Please feel free to add comments or contact me with any questions on either Sitecore Slack or Twitter.